The Network Plugin Custom Viz Plugin enables to visualize Networks dataset with Oracle Analytics. While it provides a simple way of visualizing networks, the plugin offers a comprehensive representation of all connections between various nodes in a network, various properties to adjust the visualization. The parameters that can be tuned help users understand the relationship among the nodes like distance between the nodes, significance of the nodes etc. This is useful in studying patterns within the network and in analyzing different parameters of the nodes and edges of a network.
This blog entry will show how to use the Network Graph Custom Viz plugin in this blog. This
plugin can be downloaded for free from the Oracle Analytics Library. The brief video below gives a quick glance of how the plugin works :
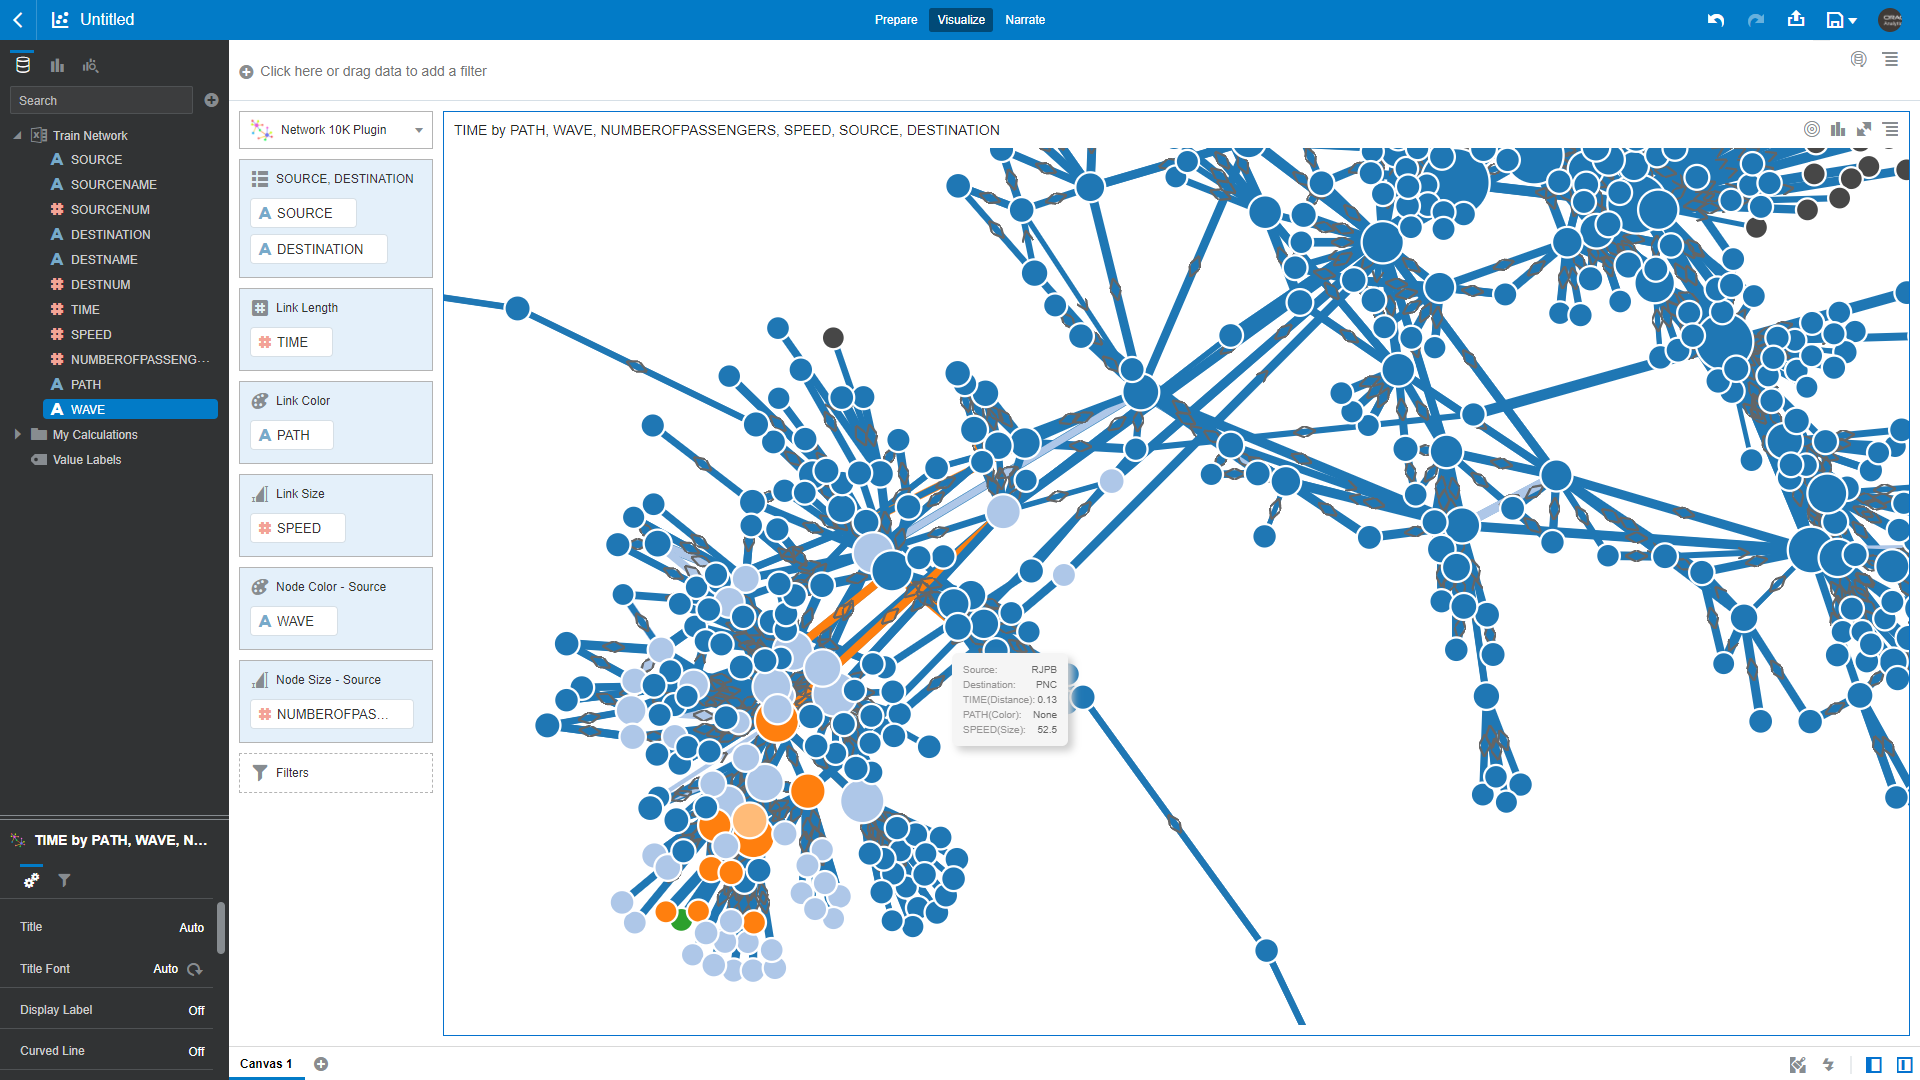
Network Graph visualizations expect at least two mandatory inputs – Source and Destination. There are optional parameters like Link weight (Length), Link Color, Link Size, Node Color – Source and Node Color – Size.

Source and Destination accepts two attributes which are source and destination of an edge in the network, in any sequence. You can drag these two starting by sources, or by destinations. With these two parameters, the plugin draws a graph with one or more clusters connecting all the possible nodes with each other.

You can represent the distance between the nodes with Link Length which accepts a column of type measure. Link Color and Link Size helps to convey the significance of every edge (link) in the network. Link Color accepts attributes and Link Size accepts measures. There are also options to specify Color and Size of the Source Nodes. When using values for color and size of nodes, it's implicit that these will represent the values for 'source' nodes in the dataset (ie the one specified first among the two columns for source-destination).
There are handful of properties to customize and fine tune the plugin rendering: show or hide the Display Labels on the nodes, turn on or off the direction labels on the edges, make the edge look straight or curved, show or hide the Legend pane and there are parameters to magnify Node size, Link size, Link length etc to enhance the network visually. You can also adjust the spacing between the clusters with Cluster Spacing Factor.


Finally, this plugin supports the various Oracle Analytics Viz-level interactions like Brushing, Keep Selected, Remove Selected and Use as Filter. It supports zoom-in and zoom-out with mouse scroll and you can drag and drop the graph to reposition it.
The animation that occurs when the plugin viz is refreshed, calculates the position of each node and edge on the network representation. This phase can take a few seconds. It's recommended that you leverage this plugin visualization with a reasonable amount of distinct edges (links) in your data, around 5k maximum, to reduce the calculation time. You might use it with large amount of data, but consider the distinct number of edges as this will impact the rendering performance.
Thanks for your time reading this blog !
3 comments:
Does it work with 6.0 OAD ?
Yes it does :)
Unfortunately I can't install this plugin. This error keeps coming: "Unable to determine the plugin id. Please check that the file you are attempting to upload contains a valid plugin and try again." Other plugins can be installed without problems. Any suggestions? Thank you!
Post a Comment