Have you ever felt the need for a rapid, automatic overview of any of the datasets that are available to you on your Oracle Analytics Cloud (OAC) instance ? From your mobile, right away, over few seconds ?
Oracle Synopsis Application now directly connects to any dataset lying on your OAC instance and immediately creates meaningful analytics out of it. It lets you interact with spreadsheets and business data in a visual and intuitive way—while you're on the go, on your mobile, within seconds.No technical training required, no specific Skills required, the app installs and connects in seconds.
This 6 minutes video gives a sense of the whole experience. The blog below shares a few more details as well.
Synopsis is available on both Android and iOS devices. At the time we are writing this blog (Feb 2019), the one for Android is a little ahead as it lets you connect to Oracle analytics cloud. The same feature in iOS would be available in few weeks with an upcoming update.
How to connect to Oracle Analytics Cloud using Synopsis
From your Synopsis App, tap the + icon in green to get an option to connect to
OAC. Provide the server details and credentials to connect to OAC. Once connected, you will see a list of all the files which are available inside of OAC. Click on a spreadsheet from all the choices you have and let it run some background analysis before rendering the first visuals.

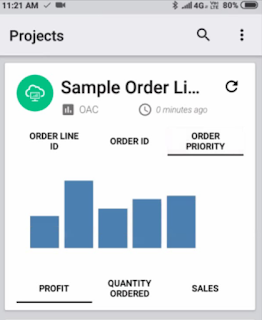
The first visuals
After a bit of background analysis, the first visuals are rendered. The top row on the screen shows 3 attribute columns that you can toggle, the bottom of the screen has 3 metrics suggested from the datasource you analyzed. Clicking on each would display a metric by attribute pair. In the screenshot you see "Profit by Order Priority"

Performance tiles of all metrics
If you wish to see the the metrics available in the datasource, simply click on "OAC". Against each tile, there are options to choose the right aggregation you want.

Choose/Edit the right columns for analysis
Click on the settings icon in the top pane to get to a screen where you can delete, move columns from metrics to attributes and rename columns. Hold on a column until a strike through appears to make sure the column is unselected. Hold and drag columns from Numbers area to Text area. Dragging columns from Text to Numbers makes them as metrics. Turn on the "Edit Column Labels" using which you can edit the column names

Further Analysis
By now I am sure you are wishing to do more with Synopsis. Lets say if you wish to analyze each metric by all the attributes available, click on a performance tile say "Sales". In this screen you will see various analysis of Sales by all the attributes.

If you wish to edit the visualizations, click on one of them where it takes you to an edit screen. In the edit mode, you would be able to change the chart type, add/remove metrics and attributes, filter the chart based on attributes.

Statistical Analysis
Once you are in the edit mode of a chart, you can choose to get some statistical information like mean min, max etc, by clicking on the yellow colored "i" icon just above the edit pencil icon

 Clicking on the button show in the image here would generate some interesting insights in the data. Things like "If a metric value goes down, then another metric goes up" would be generated by the built in analytics engine.


Natural Language Generation - Project Insights
Clicking on the button show in the image here would generate some interesting insights in the data. Things like "If a metric value goes down, then another metric goes up" would be generated by the built in analytics engine.
By editing out a metric or an attribute, the insights automatically run to provide fresh project insights with the new metrics and attributes.
Sharing the report on Social media
Reports and visuals generated on Synopsis can be shared on various media options like Whats app, email, Twitter etc. Click on the share icon on top of each report to share the particular visual.

By now you would have realized that so many functionalities can be accomplished using Synopsis. To conclude Synopsis is an app that provides actionable insights for smart decision making at your finger tips. Soon, you would be able to connect to Oracle cloud sources and leverage the same capabilities on other sources with Synopsis
Are you an Oracle Analytics customer
or user?
We want to hear your story!
Please voice your experience and provide feedback
with a quick product review for Oracle Analytics Cloud!