Friday, February 24, 2017

OracleDV: Calculate correlation between numerical and categorical variables.

In this blog we will talk about two custom R-scripts that calculates and plots(resp) Correlation not just between two numerical variables, but between numerical and or categorical variables. Before we jump into the details about this script, let us understand what is correlation. Correlation refers to the extent to which two variables have a linear relationship with each other. Some of the famous and well known measures to compute correlation between variables include: Pearson's Product Moment coefficient, Rank correlation coefficients, Kendall and Spearman coefficients. But these coefficients work well only with numeric variables. To compute correlation between two categorical variables or between a numerical and categorical variable chi-squared test or ANOVA.


In these R-scripts we tried to address the need for a script which can compute correlation between not only two numeric variables but also between numeric and or categorical variables(num vs categorical and categorical vs categorical). Like we mentioned earlier there are two custom R-Scripts, first script computes just computes the correlation and returns the results in tabular format and 2nd script computes the correlation, plots these correlation coefficients using corrplot R-package and returns these R-visualizations.These scripts use Goodman Kruskal Algorithm (more information here) to compute correlation between num vs categorical variables and categorical vs categorical variables. To compute correlation between two numeric variables the script can use various methods like : pearson, kendall and spearman depending on users' preference. To demonstrate these scripts we have attached a sample .dva project which demonstrates how the R-Scripts can be invoked in OracleDV. You can download this script from Oracle BI Public Store.This is how your OracleDV should look like after you import the .dva project:


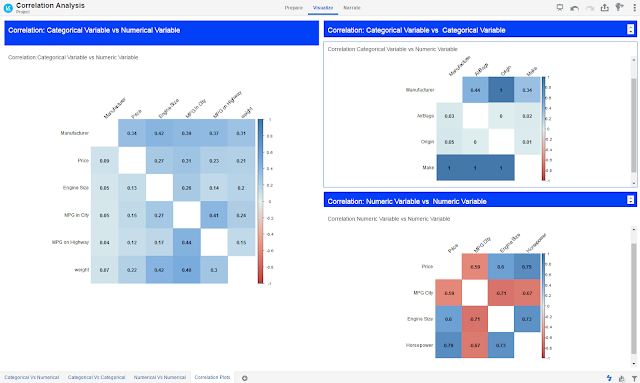
Please note that you have to deploy R Viz(Base64Image) custom plugin before you import the .dva project.

How does this scripts work: This Script computes correlation between two variables and generates plots using corrplot R-package. The variables can either be both numeric or numeric and categorical or both categorical. This script uses two methods to calculate correlation coefficient depending on the type of input variables. Following are the methods:
1) If the variables are all numeric then the script uses one of Pearson,Kendall and Spearman methods depending on users preference.
2) For computing correlation between categorical and numerical or between categorical and categorical variables, script uses Goodman Kruskal Algorithm.
 Script scans the datatype of input data frame and if all the columns are numeric then it chooses method-1 else it chooses method-2. Script returns correlation coefficient for each pair wise combination of the input columns.

Inputs:
1) id: ID to uniquely identify each column and to avoid auto aggregation.
2) column1 ... column12: Columns list for which correlation needs to be computed between each possible pair. If user needs to compute correlation between more columns, more inputs can be added to this script in exactly the same format as existing input columns.

Optional Inputs:
1) column_names: Names of the columns sent as input to the R-Script, excluding ID column. This is needed to name the columns appropriately in the output returned by R.
2) corr_method: This is applicable only if all the columns are numeric. If all the columns are numeric/metric then the script lets user choose anyone correlation method from Pearson,Kendall and Spearman.
3) plot_width: Width of the plot generated by the R-Script. Default is 400
4) plot_height: height of the plot generated by the R-Script. Default is 400

Output:
1) corr_col1: Name of first column in the pair of columns for which we are trying to compute correlation.
2) corr_col2: Name of second column in the pair of columns for which we are trying to compute correlation.
3) img* columns return the R plots in base 64 encoded image format. R Viz(base64image) custom Viz plugin parses these base64 encoded image strings and displays the image on DV Desktop canvas.

Package Dependency: corrplot, reshape, data.table, classInt, base64enc

This package contains two R-scripts:
1) R.Correlation.xml: This R-Script computes correlation between the variables.
2) R.CorrelationPlot.xml: This R-Script, in addition to computing the correlation coefficient also displays the correlation plot and converts the images to base64 encoded string formats and sends it to DV. Base64Image custom visualization converts these strings back to image.

Steps to deploy this plugin in your local Oracle DV:

1) Install Advanced Analytics feature in Oracle DV by clicking on the below icon. This will install Oracle R deployment. Alternatively you can install Advanced Analytics by running install_advanced_analytics.cmd present in <DV_INSTALL_DIRECTORY>


2) Install R-Packages:
    Open R console(double click Rgui.exe present in <Advanced_Analytics_Install_Dir>\bin\x64),
    install arules Package. Following are the R-commands to install:
     Set Proxy:
        $ Sys.setenv(http_proxy="<your_proxy_host>:<port_number>")
           set proxy appropriate to your network config.
     Install Package(updated instructions):
        $ install.packages("corrplot")
        $ install.packages("reshape")
        $ install.packages("data.table")
        $ install.packages("classInt")
        $ install.packages("base64enc")
3) Download Correlation_Analysis_V1.zip from OracleBI Public Store and unzip it.
4) Copy R.Correlation.xml and R.CorrelationPlot.xml to <DV_INSTALL_DIRECTORY>\OracleBI1\bifoundation\advanced_analytics\script_repository
5) Deploy R Viz(Base64Image) Custom visualization.
6) Import the .dva project to Oracle DV. Password for the .dva is Admin123


Are you an Oracle Analytics customer or user?

We want to hear your story!

Please voice your experience and provide feedback with a quick product review for Oracle Analytics Cloud!
 

Thursday, February 23, 2017

Customize look & feel of Oracle DV using skin plugins

In this blog post we will discuss about customizing the appearance of your Oracle DV Desktop by using skin plugins. Companies and/or users may want to change the appearance of DV for reasons such as house style, professionalism or simply for fun.

Oracle DV Desktop's UI is generated using scripts and is therefore highly customizable. The look and feel aspects is controlled by skins and styles. Customization can be achieved by editing the following css (cascading style sheet) files that can be packaged and deployed as a skin plugin.

Check out the skin plugin example on the Oracle BI Public Store. Main CSS files and key UI elements it drives are listed below. You may launch DV in SDK mode and use the property inspector in the browser to explore this yourselves.

  • applicationstyles.css - responsible for the global level styles including the logo, progress pane, menus, context-menus, font-icons, dialogs, gadgets, tooltips, etc
  • dataenrichstyles.css - responsible for the Advanced Analytics styles including the Analytics tab in the gadget dialog.
  • homepagestyles.css - responsible for the styles of  home page and data source page.
  • ojetstyles.css - responsible for the JET styles of data visualizations, tabs, buttons, menus, dialogs, trees, text input, etc.
  • reportstyles.css - responsible for the project level styles.  The majority of the non-visualization styling is handled by this css including Insights, search, color management, the fingerpane, the gadget/properties dialog, filter bar, data sources, expressions, toolbar, save dialog, etc.
 In case you want to explore further there are other css files 
  • filterstyles.css - responsible for the filter styles including the date range, expression, list and number range filters.
  • stagestyles.css - responsible for the styles of the stage and data source diagrammer.
  • thirdpartystyles.css - responsible for the styling of the 3rd party components including:
    • JQuery UI - utilized by gadget sliders, drop target tooltips, and resizable components like the image visualization, floating panels, and layouts
    • CodeMirror - utilized by the expression text editor
    • Spectrum - utilized by the color picker
  • vizstyles.css - responsible for the visualization level styles of the visualization placeholders, drop targets, image visualization, tile visualization, textbox visualization, legend, etc.

SAMPLE CUSTOMIZATION

To apply the sample customization, perform the following steps.
  • Access the sample plugin here
  • Copy the sample plugin to your plugins directory %LOCALAPPDATA%\DVDesktop\plugins
  • Restart the server
You should see something like this.

Sample Customization


You can notice that there is a change in the logo, background color of header and that there is a green colored theme in your Oracle DV.

This was achieved by making the following changes:
  • In application-styles.css, the Oracle logo was replaced with a new logo
.bi-va-icon-oraclelogo_15:before{  
-   content:"\e666"; 
+  content: url("star_logo.png"); 
}
CAVEAT: The logo must be of the size 130 x 25 px in width and height respectively. Incorrect size would need more corrections to fit it within that frame. Also make sure that you provide the correct name of the logo.

  • The dark green background color was applied to the header by making the following change to the homepagestyles.css
.bitech-global-header > div:first-child{
display:table-row;
width:100%;
height:36px;
outline:0; 
background-color: green;

  • The light green background color to the explore panel was applied by making the following change in the reportstyles.css 
.bi_fp_content{
position:absolute;
overflow:auto;
top:48px;
bottom:33px;
left:10px;
right:0px;
width:auto; 
+ background-color: #C0D9AF;
}
There are many more css changes that needs to be done to achieve the customization shown in the sample customization. However all the changes follow the same form as what is described above.

Are you an Oracle Analytics customer or user?

We want to hear your story!

Please voice your experience and provide feedback with a quick product review for Oracle Analytics Cloud!
 

Tuesday, February 21, 2017

Build your own Recommendation engine(Collaborative Filtering) on Oracle DV using Custom R-Scripts


In this blog we will discuss about a custom R-script that creates a Recommendation engine by performing collaborative filtering. Before we get into any details about this R-script let us understand what is Collaborative Filtering and Recommendation system/engine. Collaborative Filtering is a method of making automatic predictions(filtering) about the interests of a user by collecting preferences or taste information from multiple users(collaborate). The underlying assumption of the collaborative filtering approach is that if a person A has the same opinion as a person B on an issue, then A is more likely to have B's opinion on a different issue/object than that of a randomly chosen person. So when you have to design a recommendation engine which recommends items to be purchased by a user say A based on his past purchases, it can perform collaborative filtering by checking who else bought same products as user A and what additional items were bought by those users and recommends those additional items to user A based on ratings. In addition to the recommendation, collaborative filtering can also predict what could be the possible Rating given to the recommended product by user A. This custom R-script can be downloaded from Oracle BI Public store. This is the R-Script to download :


In addition to the R-Script we have provided you a sample dva project which demonstrates how to use the R-Script. This is how the project looks like after importing the .dva file in DV Desktop:


How does this script work: This script performs Collaborative Filtering by taking data on purchases/subscriptions/movies watched along with the ratings and returns top N recommendations for users along with rating that is expected(predicted) to be given by the user for those recommended items. This script performs two kinds of collaborative filtering depending on the users' input and they work as follows:
1) User Based Collaborative Filtering (UBCF): Look for users who share the same rating patterns with the active user (the user whom the prediction is for). Use the ratings from those like-minded users found in step 1 to calculate a prediction for the active user.
2) Item Based Collaborative Filtering (IBCF): users who bought x also bought y : Build an item-item matrix determining relationships between pairs of items. Infer the tastes of the current user by examining the matrix and matching that user's data.
Please note that IBCF is resource consuming process, so we recommend to save and reuse the Recommender model incase you are using IBCF. This can be done by setting optional parameter reuse_savedmodel to "YES". If you are reusing the model, then please make sure that you are reusing it on identical data i.e., User and Item Names/Ids should be the same as stored in the model.

This script also provides the option to save the prediction model and reuse it later. If we are reusing the saved model, then the data using which the model is created/saved will act as train data and current data will act as the test data. Application of this script is not limited to datasets related Movies/Television it can be applied for other product segments like books and/or for products from different categories.

Inputs to the Script:
1) userid: Name/ID of the user
2) itemid: ID of the item.

3) rating: Rating given by user for this item.

Optional Inputs: 
1) topn: Top N recommendations to be returned for each user.
2) method: What is the collaborative filering method to be used. Options are UBCF and IBCF
3) reuse_savedmodel: Option to choose already saved model for prediction or to create a new model. If reuse_savedmodel is set to "YES", currently saved model will be reused. If no model exists as of now, a new model will be created. If reuse_savedmodel is "NO" a new model will be created even if a model exists.
4) model_directory: Place where the created model should be saved. Even if you choose not to reuse the saved model, please select a valid directory to save the model as the script requires the model to be saved on disk. I am choosing temp directory, so that I need not worry about cleaning it up manually every time. Make sure you have correct privileges on the directory.

Output: 
1) userid: Name/ID of the user
2) recommended_item: ID/name of the item recommended.
3) predicted_rating: Predicted rating for the recommended item.
4) dummy: Dummy output.

R Packages needed:
1) reshape2
2) recommenderlab


Steps to deploy this plugin in your local Oracle DV:

1) Install Advanced Analytics feature in Oracle DV by clicking on the below icon. This will install Oracle R deployment. Alternatively you can install Advanced Analytics by running install_advanced_analytics.cmd present in <DV_INSTALL_DIRECTORY>


2) If not installed reshape2 & recommenderlab Package already, please install it using following instructions:
    Open R console(double click Rgui.exe present in <Advanced_Analytics_Install_Dir>\bin\x64),
    install arules Package. Following are the R-commands to install:
     Set Proxy:
        $ Sys.setenv(http_proxy="<your_proxy_host>:<port_number>")
           set proxy appropriate to your network config.
     Install Package(updated instructions):
        $ install.packages("reshape2")
        $ install.packages("recommenderlab")
3) Download Collaborative_Filtering_V1.zip from OracleBI Public Store and unzip it.
4) Copy R.CollaborativeFiltering.xml to <DV_INSTALL_DIRECTORY>\OracleBI1\bifoundation\advanced_analytics\script_repository
5) Create a directory Model_dir under D drive. This is to save the model files. If you intend to save the model files in a different directory, then please change the value of model_directory parameter in inputs to EVALUATE_SCRIPT function in DV.
6) Import the .dva project to Oracle DV. Password for the .dva is Admin123

Are you an Oracle Analytics customer or user?

We want to hear your story!

Please voice your experience and provide feedback with a quick product review for Oracle Analytics Cloud!
 

Monday, February 20, 2017

OracleDV : Calculating distance using latitude/Longitude


In this blog we will talk about how to compute distance between two points using latitude and longitude using inbuilt functions in Oracle DV. In Geospatial Analysis, requirement to compute distance between two points using latitude and longitude is quite prevalent. Haversine formula is frequently used to calculate distance between two points on earth using latitudes and longitudes. Haversine formula computes great circle distance(distance as measured along the surface of earth/sphere rather than the distance through the sphere/earth). This formula is based on a generic formula in Spherical trignometry, called law of haversines. Following is the formula:


* snapshot taken from Movable Type Script site

Following is the calculation in OracleDV to compute the distance between two lat longs using Haversine formula:

CASE 
WHEN Source_Lat=Dest_Lat AND Source_Long=Dest_Long 
THEN 0 
ELSE 
ACOS(
  COS(RADIANS(90-Source_Lat)) 
* COS(RADIANS(90-Dest_Lat)) 
+ SIN(RADIANS(90-Source_Lat))
* SIN(RADIANS(90-Dest_Lat))
* COS(RADIANS(Source_Long-Dest_Long))  )
6371 
END

In this formula:
Source_lat refers to Source Latitude
Source_Long refers to Source Longitude
Dest_Lat refers to Destination Latitude
Dest_Long refers to Destination Longitude

Please note that Source and destination are used only for naming convenience, they can actually be used interchangeably. Distance computed using lat long may differ from the actual driving distance between two points depending on various factors such as road connectivity and presence of other geographic bodies. Here is a snapshot of the project on Oracle DV Desktop.


More information on Haversine formula can be found here.

Applications: Ability of OracleDV to handle such distance calculated formulae demonstrates the capability of DV to perform spatial analytic operations which involve calculating the number of stores/customers within a radius of certain driving distance etc. To demonstrate this capability better we have implemented a sample project using this formula to find out what are the establishments within 2 mile radius of WESTERN STATE BANK. Here is a snapshot:


We have attached the .dva project as well. You can download it from here and play with it.

Are you an Oracle Analytics customer or user?

We want to hear your story!

Please voice your experience and provide feedback with a quick product review for Oracle Analytics Cloud!
 

Friday, February 17, 2017

Geolocate IP Address on OracleDV using Custom R-Script


Prerequisite - Internet Connection
In this blog we will discuss about how to Geolocate IP Address on OracleDV using Custom R-Script. Geolocation is the process of identification or estimation of the real-world geographic location of an object like Mobile phone or a Computer/Machine. Real-world geographic location details include City,Region,Country,Postal code and most importantly Latitude and Longitude etc. This script uses freegeoip.net web service to geolocate the IP address. This script takes IP Address and an ID column which uniquely identifies this IP address, invokes the web service and returns geographic details of the location where this machine is used. These details include Latitude,Longitude, City, Country, Region Postal Code among other information. This script can be downloaded from Oracle BI Public Store and here is how your DV Desktop will look like after deploying this plugin:


Please note:
1) You have to deploy Heat Map custom visualization plugin from Oracle BI Public store to get above rendering.
2) freegeoip.net restricts number of requests from a particular ip to 15000/hour. If the number of requests exceed 15000 in an hour it throws http 403 forbidden error, before your quota is refurbished.
3) As of now the script invokes this service for each and every IP, as a result this can be little slow. We will try to improve this script further as soon as freegeoip.net provides interface/API to make bulk requests.

How does this script work: This script performs GeoTagging for IP Address. It takes IP Address(both IPv4 and IPv6 formats) as input and returns the latitude and longitude where the machine/computer with this IP address is operating. This script uses a webservice called freegeoip.net. In this script we invoke this service by calling the HTTP API by passing in the IP Address. In addition to the latitude and longitude details, it returns other geographic information like country name, region/state name, zip code, time zone etc. For invalid IP addresses, the script populates all the result columns values with "Invalid IP Address". Since this invokes freegeoip.net webservice, internet connection is mandatory for this script. This script uses rjson r-package.
NOTE: this script does not guarantee to return the latitude and longitude details for each and every valid IP Address neither does it guarantee to return these geographic details completely/accurately.

Inputs to the Script:
1) ID: which uniquely determines the IP Address. This column is needed to join back the result set returned by R to the dataset in DV
2) ipaddr : IP Address. Both IPV4 and IPV6 formats are accepted.

Optional Inputs:
proxy_url : If your network requires you to use some proxy(because of some firewall or VPN), please specify the proxy url with the port number.

Output:    
1) Geographic details: This script returns the geographic details of the location where this IP Address is located. Geographic details include City, State/County/Region, Country, zip code, time zone and lat long.
2) Located: If the IP Address couldn't be located, the script returns the column "located" with value "N". If the IP Address is successfully located it returns "Y".

Steps to deploy this R-Script plugin in your local OracleDV:
1) Install Advanced Analytics feature in Oracle DV by clicking on the below icon. This will install Oracle R deployment. Alternatively you can install Advanced Analytics by running install_advanced_analytics.cmd present in <DV_INSTALL_DIRECTORY>


2) If not installed rjson R package already, please install it using following instructions
    Open R console(double click Rgui.exe present in <Advanced_Analytics_Install_Dir>\bin\x64) and
    install rjson Package.
    Following are the R commands to install:
     Set Proxy:
        $ Sys.setenv(http_proxy="http://<your_proxy_host>:<port>")
           set proxy appropriate to your network settings.
     Install Package:
        $ install.packages("rjson")
3) Download GeoLocate_ipaddress_V1.zip from OracleBI Public Store and unzip it.
4) Copy R.GeoLocateIPAddress.xml to <DV_INSTALL_DIRECTORY>\OracleBI1\bifoundation\advanced_analytics\script_repository
5) Download and deploy Heat Map custom visualization plugin from Oracle BI Public Store. Instructions to deploy this Custom Viz plugin are described in the Public store.
6) Import the .dva project to Oracle DV. Password for the .dva file is Admin123
    NOTE: 
Use Proxy_Url optional parameter in EVALUATE_SCRIPT only if your network requires you to use proxy.


Are you an Oracle Analytics customer or user?

We want to hear your story!

Please voice your experience and provide feedback with a quick product review for Oracle Analytics Cloud!
 

Wednesday, February 15, 2017

Reverse Geocoding on OracleDV using Custom R-Scripts

Pre-requisites: Internet connection

In this blog we will discuss about an interesting and new addition to Oracle BI Public Store : custom R-Script to perform Reverse Geocdong on OracleDV. Reverse Geocoding is the process of back(reverse) coding of a point location (latitude,longitude) to a readable address or place name. This helps in identifying a nearby street address,places, areas, county, state ,country etc. This custom R-Script takes latitude and longitude details as input and returns Address in a general format with details like, House number, Street name, Settlement/Area/County/Muncipality, city, state, country and Postal code details. This script can be downloaded from Oracle BI Public Store and here is how your DV Desktop will look like after deploying this plugin:


Please note that you have to deploy Custom Points Map custom visualization plugin from BI Public store to get this rendering.

How does this script work: This script performs Reverse Geocoding by taking longitude and latitude as inputs and returning the address of that particular location. This script uses Oracle Geocoder service to identify the locations. So internet connection is required for this script to work. Please note that some countries like Japan are not supported by reverse geocoding as of now. For Latitude Longitude falling in those geographies, currently the script will not be able to identify the address. Geocoder service accepts requests in the following xml format:

<geocode_request vendor="elocation">
  <address_list>
    <input_location id="27010" country="us" longitude="-122.26193971893862" latitude="37.53195483966782" />
    .....
  </address_list>
</geocode_request>

In the above format, element and attributes between <input_location id = "XXXX" ...... /> represents a row. In the script we construct xml request with this format, batch the requests and send for geocoding. This script uses httr and XML R packages.

Please note
1) This script does not guarantee to geocode each and every longitude and latitude given, neither does it guarantee to provide accurate details, these are only approximations.To differentiate between the latlong that could be reverse geocoded and that could be not, we have added a flag called "address_located" which will be set to "Y" if the latlong could be reverse Geocoded and "N" if not.
2) Please clean the Data for any NULLS/NAs in latitude or longitude columns

Inputs to the Script:
1) ID: this is a mandatory column and identifies the combination of lat/long
2) longitude: Longitude of the location to be identified
3) latitude : Latitude of the location to be identified

Optional Inputs:
1) service_url : Specify the URL for Oracle geocoder service. If you do not specify anything by default the current ongoing version of Oracle Geocoder service.
2) proxy_url : If your network requires you to use some proxy(because of some firewall or VPN), please specify the proxy url with the port number.

Output:      
1) This script gives the address in a general format that is broken into individual components like house_number, street, settlement, city, state, country, postal_code. Please note that all the components of address are not guaranteed to be present for each identified address. Some components for some addresses may not be returned by the R-script.
2) address_located: This column tells whether the latlong could be reverse geocoded or not. If address_located is "Y" then the latlong was successfully identified. If address_located is "N" then the latlong could not be located successfully.

Steps to deploy this R-Script plugin in your local OracleDV:

1) Install Advanced Analytics feature in Oracle DV by clicking on the below icon. This will install Oracle R deployment. Alternatively you can install Advanced Analytics by running install_advanced_analytics.cmd present in <DV_INSTALL_DIRECTORY>


2) If not installed httr and XML R packages already, please install it using following instructions
    Open R console(double click Rgui.exe present in <Advanced_Analytics_Install_Dir>\bin\x64) and
    install httr & XML Package.
    Following are the R commands to install:
     Set Proxy:
        $ Sys.setenv(http_proxy="http://<your_proxy_host>:<port>")
           set proxy appropriate to your network settings.
     Install Package:
        $ install.packages("httr")
        $ install.packages("XML")
3) Download Geocoding_V1.zip from OracleBI Public Store and unzip it.
4) Copy R.Geocoding.xml to <DV_INSTALL_DIRECTORY>\OracleBI1\bifoundation\advanced_analytics\script_repository
5) Download and deploy Custom Points Map custom visualization plugin from Oracle BI Public Store. Instructions to deploy this Custom Viz plugin are described in the Public store.
6) Import the .dva project to Oracle DV. Password for the .dva file is Admin123
    NOTE:
Use Proxy_Url optional parameter in EVALUATE_SCRIPT only if your network requires you to use proxy.


Are you an Oracle Analytics customer or user?

We want to hear your story!

Please voice your experience and provide feedback with a quick product review for Oracle Analytics Cloud!
 

Tuesday, February 14, 2017

OracleDV : Geocode Address data with Custom R-Script

Pre-requisites: Internet connection

In this blog we will discuss about an exciting possibility on OracleDV: How to Geocode Address data to extract latitude and longitude information using custom R-script. This Custom R-Script takes Address data and locates the address by identifying Latitude and Longitude. Address can either be a single line like "200 Oracle Pkwy,Redwood City, CA 94065" or it can be in a general format with Street, House Number, Area, City, State, Country details specified.  This script can be downloaded from Oracle BI Public Store and here is how your DV Desktop will look like after deploying this plugin:


Please note that you have to deploy Custom Points Map custom visualization plugin from BI Public store to get this rendering.

What is Geocoding and how does this script work: It is a computational process of transforming postal address description to a location in the earth's surface. This Script uses Oracle Geocoder web service. So internet connection is required for this script to work. As of now Oracle Geocoder service doesnt support following countries China, South Korea and Japan. If you want to geocode a non-us address, make sure that you pass country name as an input to EVALUATE_SCRIPT.  Geocoder service accepts requests in many xml formats. In this script we generate either Unformatted Address type XML which has the following structure:

<geocode_request vendor="elocation">
  <address_list>
    <input_location id="1000">
      <input_address match_mode="DEFAULT">
        <unformatted Country="Brazil">
          <address_line value="Pawtucket 7935 Shasta Way"/>
        </unformatted>
      </input_address>
    </input_location>
.....
</address_list>
</geocode_request>

or General form XML which has following structure:

<geocode_request vendor="elocation">
  <address_list>
    <input_location id="27010">
      <input_address match_mode="DEFAULT">
        <us_form2 street="500 oracle pky" city="redwood city" state="ca"/>
      </input_address>
    </input_location>
.....
  </address_list>
</geocode_request>

In the above formats, elements and attributes between <input_location id = "XXXX">  and </input_location> represents a row. Depending on the input address format type, in the script we construct xml request with one of the above formats. We batch those requests and send 1000 records at a time for geocoding. This script uses httr and XML R packages.

Please note that this script does not guarantee to geocode each and every address given, neither does it guarantee to provide accurate address these are only approximations. To differentiate between the addresses that could be found and not found, we have added a flag called "address_located" which will be set to "Y" if the address could be geocoded and "N" if the address cannot be geocoded.


Inputs to the script:
This script can take two kinds of inputs: First is an address passed in as a single unformatted string for example "500 Oracle Parkway. Redwood Shores, CA 94065." or address in general format which is broken into individual components like House number, street, city, state, Postal code etc. Please note ID column is a mandatory input for both the kinds of inputs. Here is a brief on what inputs should be sent to the R-script for each of these addresss kinds.
1) Unformatted : If your address is an unformatted single string, then you should pass in id column(which is the identity column required to identify the address) and address_string which contains the unformatted address.
NOTE: If the country details are missing in the unformatted string, please specify the country name for greater accuracy.
2) GeneralForm : In your dataset if you have the address in formatted structure with broken up components like Street, City, State, Country etc then along with ID column you need to send Street,  City,State,Country,Postal_code details.

Optional Inputs:
1) address_format : Specify the address format of the inputs. Like mentioned above currently we support two address formats : "unformatted" and "gen_form"
2) service_url : Specify the URL for Oracle geocoder service. If you do not specify anything by default the current ongoing version of Oracle Geocoder service.
3) proxy_url : If your network requires you to use some proxy(because of some firewall or VPN), please specify the proxy url with the port number.

Output:    
This R-Script outputs Longitude, Latitude for the address and it also returns an additional column called address_located which tells whether the address could be geocoded or not. If address_located is "Y" the address was successfully geocoded. If address_located is "N" then the address could not be located successfully.

Steps to deploy this R-Script plugin in your local OracleDV:

1) Install Advanced Analytics feature in Oracle DV by clicking on the below icon. This will install Oracle R deployment. Alternatively you can install Advanced Analytics by running install_advanced_analytics.cmd present in <DV_INSTALL_DIRECTORY>


2) If not installed httr and XML R packages already, please install it using following instructions
    Open R console(double click Rgui.exe present in <Advanced_Analytics_Install_Dir>\bin\x64) and
    install httr and XML Packages.
    Following are the R commands to install:
     Set Proxy:
        $ Sys.setenv(http_proxy="http://<your_proxy_host>:<port>")
           set proxy appropriate to your network settings.
     Install Package:
        $ install.packages("httr")
        $ install.packages("XML")
3) Download Geocoding_V1.zip from OracleBI Public Store and unzip it.
4) Copy R.ReverseGeocoding.xml to <DV_INSTALL_DIRECTORY>\OracleBI1\bifoundation\advanced_analytics\script_repository
5) Download and deploy Custom Points Map custom visualization plugin from Oracle BI Public Store. Instructions to deploy this Custom Viz plugin are described in the Public store.
6) Import the .dva project to Oracle DV. Password for the .dva file is Admin123
   
NOTE: Use Proxy_Url optional parameter in EVALUATE_SCRIPT only if your network requires you to use proxy.


Are you an Oracle Analytics customer or user?

We want to hear your story!

Please voice your experience and provide feedback with a quick product review for Oracle Analytics Cloud!