Oracle Analytics platform provides multiple functions to analyze and better understand your data. This blog explains a prebuilt function that makes it very simple to calculate Pearson's Correlation Coefficient (PCC) between two columns. This function is called CORN in Oracle Analytics. Before going any further let us remember what correlation coefficient is and what it is used for.
What is correlation coefficient?
Correlation coefficients are used to measure the strength of relationship is between two metrics. Pearson’s correlation coefficient (PCC) is commonly used for statistical analysis. The correlation coefficient ranges from -1 to +1. The meaning of this value is:
- When the coefficient is 1, it means the metrics are perfectly correlated to each other.
- When the coefficient is -1, it means the metrics are inversely correlated to each other.
- When the coefficient is 0, it means the metrics are not correlated to each other.
The formula for calculating PCC between two columns X, Y with n data points is as follows.
Note an implicit yet aspect of this expression : the grain of the data, ie what each individual record represents. Implicit is, that X Y data pairs are available at the level needed for the analysis. For example : correlation between car weight (X) and avg fuel consumption (Y), is implicitly meant 'by car'. Input data is typically distinct weight and fuel consumption for each car in a population of N cars. The grain of the data here, is car level.
But perhaps that same analysis is meaningful as well at a different level : by car makers maybe, or by type of fuel, or by type of engine... Changing the grain means to provide the input data at an aggregated level for the new grain. If we wanted correlation of X and Y by car manufacturer, we would need to average, for any given car maker, the weight of every cars he produced as well as the avg fuel consumption for that same group. That, would become the input data to our correlation function.
Understanding CORN Function
So now, let us take a look at the CORN function in Oracle Analytics and understand its components.
CORN function syntax requires 3 parameters as follows:
CORN(Metric1, Metric2 AtGrain(Attribute) )
- Two Metrics – Metrics for which the correlation coefficient has to be calculated
- One Attribute – the grain of the data at which the correlation is calculated
The CORN function does not take any implicit decision, and hence will expect from the user that he specifies the grain he expects the computation for. If employees data in a database is at the employee level (one row for each employee), the CORN function will require user to specify what level it should compute by. For example, if user specifies Department, the function will automatically aggregate the metrics X and Y by department first, then calculate the correlation on the resultset at that level.
Let's say we are analyzing correlation between two employee columns “AGE” and “JOBSATISFACTION” , but we want it at “DEPARTMENT” level grain. Go to My Calculations :
Example (Grain @ Row ID)
There are instances when you user may want the grain level to be each row from the dataset. If a row level identifier exists for the dataset, then that's to be used in the AtGrain condition. If unique identifier does not exist, then create one using Rowid() function as show in the following blog : Unique ID Creation
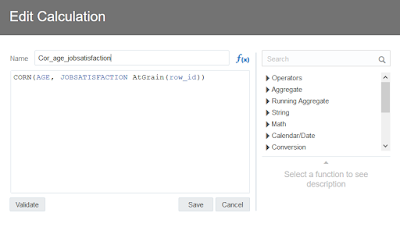
Once we have that we can replicate the CORN function at ROW_ID level. Go to My Calculations and apply function : CORN(AGE, JOBSATISFACTION AtGrain(ROW_ID) )
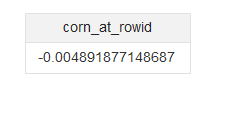
You can view the correlation value at ROW_ID level.
Drag and drop the column on the canvas to see the calculated value. Once the calculation is on canvas, you can filter by one of the attributes and observe how the metrics are correlated for that selection.
CORN function is useful and handy for understanding the relationship between metrics in depth and help you understand the relationship between columns better.
If you need to apply this function to a matrix of different metrics columns at once, then use the correlation matrix vanilla visualization. This Viz will provide you with a heatmap matrix with correlation values for each intersections in your matrix.
Note that in this case, the grain of the calculation is defined by setting an argument in the Detail field, on the viz grammar pane.
Thanks for reading the blog!


2 comments:
Great function, really (and it works also in Oracle Analytics Server 5.5 to my surprise). Why this is not documented in official OAC/OAS documentation ? This leads to my other question - how many other "hidden jewels" is OAC/OAS offering (besides this CORN function I learned recently about ROW_ID function also on this site) ?
Really I enjoy your site with effective and useful information. It is included very nice post with a lot of our resources.thanks for share. i enjoy this post.
SEO Agency Gloucester
Local SEO Company
Best SEO Company Uk
Local SEO Company Uk
Post a Comment