As an Operations head of a chain of multi brand retail stores if you are trying visualize and identify areas with highest population density or with highest economic activity to open new stores, Heatmaps are extremely useful. What are Heatmaps? Heatmap is a graphical representation of data that use a system of color-coding to represent different values. In this blog we will discuss about new Heatmap Visualization on Maps in the latest version of Oracle Analytics.
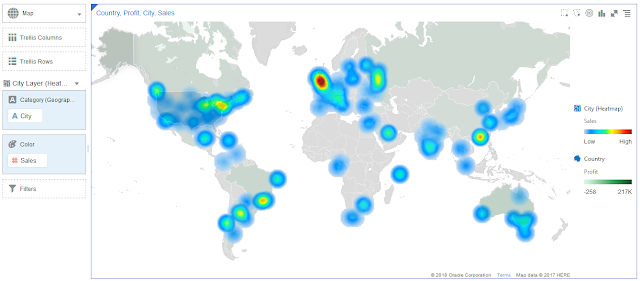
Heatmaps have various applications and can take different forms. For example Heatmaps can be used to visualize variance across and correlation between variables in a dataset, they can also be used to give visual representation of user clicks on a website, another good use of heatmap is it can be used to depict the intensity of data at geographical points on a Map visualization. Here is a quick snapshot of how a heatmap visualization in Oracle Analytics which visualizes sales by city looks like:
How to create Heatmap based map visualizations in Oracle Analytics Cloud?
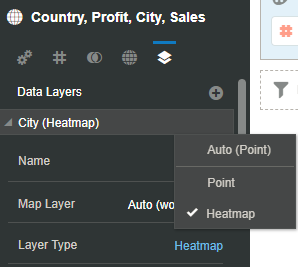
Heatmaps can be created using Point geometry based map layers. After visualizing data using a point geometry based map layer, choose the Layer type to be Heatmap.
Heatmaps in Oracle Analytics can be density based or Metric based. In density based Heatmap color intensity at a point depicts the density or number of points in a particular region on the map visualization. Density heatmaps can be generated by populating Category(Geography) grammar field with the geographic column and by leaving the Color grammar field empty. In Metric based heatmap color intensity at a point is influenced by the aggregated value of metric in a particular region on map visualization. To visualize a metric based heatmap populate Color grammar field with a metric.
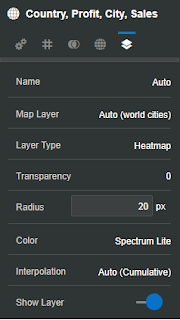
Users are provided multiple options to influence and customize how data is visualized on a heatmap. Options like what should be the radius of each point on heatmap, color spectrum i.e., points/areas with highest density or metric value should be displayed in Orange or blue or any other custom color, Layer Transparency, Interpolation etc. Here is a quick snapshot showing all options:
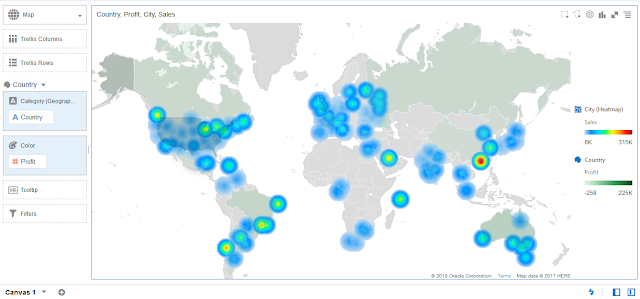
Interpolation option is specific to heatmap visualizations and it influences the way in which points are rendered on a heatmap. For example if Interpolation is set to Maximum, points with maximum value are highlighted more. Similarly for minimum, points with lowest or minimum value is displayed to draw attention. Here is a heatmap visualization with Interpolation set to Maximum:
In addition to Cumulative, Maximum, Minimum other options for Interpolation style are Average, Average(Constant).
Depending on the aggregate rule that is set for a metric, Oracle Analytics chooses interpolation style automatically. For example columns on which Aggregate rule is set to Sum, Cumulative would be chosen as interpolation style automatically. Similarly metrics for which aggregation rule is set to Maximum, minimum, Average interpolation would be automatically set to Maximum, Minimum or Average respectively. Users can change these auto assigned interpolation styles later. Another important aspect to be noted is since Heatmap does not treat individual points as discrete, consequently brushing, selection, tool tips do not work for points on a heatmap.
To summarize Oracle Analytics lets users visualize their data on a Map visualization using heatmap with great many options to influence the way data is rendered on a heatmap. This video to demonstrate various features of heatmaps in Oracle Analytics:
Heatmaps have various applications and can take different forms. For example Heatmaps can be used to visualize variance across and correlation between variables in a dataset, they can also be used to give visual representation of user clicks on a website, another good use of heatmap is it can be used to depict the intensity of data at geographical points on a Map visualization. Here is a quick snapshot of how a heatmap visualization in Oracle Analytics which visualizes sales by city looks like:

How to create Heatmap based map visualizations in Oracle Analytics Cloud?
Heatmaps can be created using Point geometry based map layers. After visualizing data using a point geometry based map layer, choose the Layer type to be Heatmap.

Heatmaps in Oracle Analytics can be density based or Metric based. In density based Heatmap color intensity at a point depicts the density or number of points in a particular region on the map visualization. Density heatmaps can be generated by populating Category(Geography) grammar field with the geographic column and by leaving the Color grammar field empty. In Metric based heatmap color intensity at a point is influenced by the aggregated value of metric in a particular region on map visualization. To visualize a metric based heatmap populate Color grammar field with a metric.


In addition to Cumulative, Maximum, Minimum other options for Interpolation style are Average, Average(Constant).
Depending on the aggregate rule that is set for a metric, Oracle Analytics chooses interpolation style automatically. For example columns on which Aggregate rule is set to Sum, Cumulative would be chosen as interpolation style automatically. Similarly metrics for which aggregation rule is set to Maximum, minimum, Average interpolation would be automatically set to Maximum, Minimum or Average respectively. Users can change these auto assigned interpolation styles later. Another important aspect to be noted is since Heatmap does not treat individual points as discrete, consequently brushing, selection, tool tips do not work for points on a heatmap.
To summarize Oracle Analytics lets users visualize their data on a Map visualization using heatmap with great many options to influence the way data is rendered on a heatmap. This video to demonstrate various features of heatmaps in Oracle Analytics:
Are you an Oracle Analytics customer
or user?
We want to hear your story!
Please voice your experience and provide feedback
with a quick product review for Oracle Analytics Cloud!
1 comment:
nice blog , very helpful and visit us for VISUALIZATION SERVICES in India
Post a Comment