This blog shows a preview of an upcoming OAC 5.5 feature. OAC 5.5 is expected to be GA very soon by Oracle (Jan 2020), the feature will become available then.
In the 5.5 release of OAC (Oracle Analytics Cloud) creating custom Infographics visualizations is made simple through the use of custom dynamic canvas backgrounds and the new spacer visualization. Infographics created on OAC can then be used from any device (browser or mobile) and dynamically resize per the screen size.
In the 5.5 release of OAC (Oracle Analytics Cloud) creating custom Infographics visualizations is made simple through the use of custom dynamic canvas backgrounds and the new spacer visualization. Infographics created on OAC can then be used from any device (browser or mobile) and dynamically resize per the screen size.
In this example we are building a infographic showing stats about NFL fans attendance. We selected a custom picture of a stadium that we want to use as a custom background to our infographics.
1. Setting custom DV background with an image.
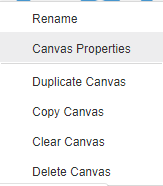
To configure that image as a custom background, we are using Canvas Properties menu by right-clicking on the Canvas tab itself and selecting the option. Once there, we are setting the value Cutom for Background property.
There, pick the image location, adjust transparency and make sure you set size parameters to Auto-Fit, this will ensure your DV sample scales regardless of your screen size and resolution.

2. Laying out visualizations
In our example, we will use a combination of vertical bar charts and horizontal bar charts, along with the tag cloud extension. As we build our visualizationsm we can use the spacer visualization (OAC5.5), to customize our layout exactly as we need it…


Blog Collateral
Watch this short 3 minute video - Spacer Viz and Custom Background that comes OOB with OAC 5.5.
Are you an Oracle Analytics customer
or user?
We want to hear your story!
Please voice your experience and provide feedback
with a quick product review for Oracle Analytics Cloud!
7 comments:
A great information about data visualization tool. Simply you have elabourated about the tools in a great manner.Thanks for sharing information with us.
hello, you know your article is amazing and this article is helping for me and everyone and thanks for sharing information tq
Oracle Training Course in Delhi
The main motive of the Big Data Solutions Developer is to spread the knowledge so that they can give more big data engineers to the world.
Thanks a lot for sharing this valuable information about data visualization and multivariate data analysis
good information oracle training in chennai
Grab the Digital Marketing Training in Chennai from Infycle Technologies, the best software training institute, and Placement center in Chennai which is providing professional software courses such as Data Science, Artificial Intelligence, Cyber Security, Big Data, Java, Hadoop, Selenium, Android, and iOS Development, DevOps, Oracle, etc with 100% hands-on practical training. Dial 7502633633 to get more info and a free demo and to grab the certification for having a peak rise in your career.
Thank you for sharing the complete process with the proper video. We also offer custom Infographics Services that are based on customer's requirements.
Post a Comment