This blog shows a preview of an upcoming OAC 5.5 feature. OAC 5.5 is expected to be GA very soon by Oracle (Jan 2020), the feature will become available then. In the 5.5 release of OAC (Oracle Analytics Cloud) creating custom Infographics visualizations is made simple through the use of custom dynamic canvas backgrounds and the new spacer visualization. Infographics created on OAC can then be used
from any device (browser or mobile) and dynamically resize per the screen size.
In
this example we are building a infographic showing stats about NFL fans attendance. We selected a custom picture of a stadium that we want to use as a custom background to our infographics.
1. Setting custom DV background with an image.
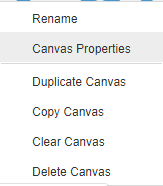
To configure that image as a custom background, we are using Canvas Properties menu by right-clicking on the Canvas tab itself and selecting the option. Once there, we are setting the value Cutom for Background property.
There, pick the image location, adjust transparency and make sure you set size parameters to Auto-Fit, this will ensure your DV sample scales regardless of your screen size and resolution.
All we have to do next is to start building our infographic by positioning visualizations on top of that picture.
2. Laying out visualizations
In our example, we will use a combination of vertical bar charts and horizontal bar charts, along with the
tag cloud extension. As we build our visualizationsm we can use the spacer visualization (OAC5.5), to customize our layout exactly as we need it…
we can drag the spacer extension to create separations between different visualizations. It can be resized as needed, just like other vizs, flipped
either horizontal or vertically and set background color or as an image. While we are organizing our vizs, the canvas properties keep to the default autofit configuration, which means the whole page will properly resize accoding to screen size of the consuming devices.
Once our visualizations content and
layout completed we can customize additional display properties such as
font color and size for all report components, i.e, title, values, x/y axis
Blog Collateral
Watch this short 3 minute video -
Spacer Viz and Custom Background that comes OOB with OAC 5.5.
Being able to calculate Period to Period growth and growth rates is a common need in most analytics insights today. OAC provides a robust semantic layer capability to do this with the OAC Metadata Repository where time hierarchies and rich time series calculations can be defined and modeled. But most often in self-service-analytics context, we quickly upload a file-based dataset and don't take time to model a metadata layer on it. We directly run visualizations on the data, and we soon need to start defining calculations like time series, growth rates etc... to extract deeper insights.
How to calculate Period to Period with an Oracle DV datasource and no repository ?
This blog highlights a simple technique to build any period to period calculations without building an RPD model with OAC. There are several ways this can be achieved, this entry explains a direct way of running live calculations using a data-source join preparation. Other upcoming blog entries will detail other alternative techniques for similar calculations.
This 6 minute video goes through the process of defining this, below are some illustrated steps as well.
Our data is an excel dataset with a list of 10K orders over several years. Each order has a date and several attributes and metrics. One of the many attribute is the Product Category (3 distinct values), and another is Customer Segment (4 distinct values). We do need to calculate Y/Y growth of monthly sales by Customer Segment by Product Category.
The calculation needed here must be able to properly aggregate Sales it by these attributes (Month, Segment, Category), call the same value for last year, and then compile the growth rate. As we have no repository on our xls upload, we have no semantic Time Hierarchy availalbe. So we cannot leverage the Time Series specific calculations in OAC.
To achieve this dynamic calculation in OAC DV, we can use a simple technique : duplicating the initial dataset in Oracle DV, and joining the two duplicate sources with a Period <---> (Period -1) join. If we do this, the initial dataset will still show actual period in the project, and the duplicated - joined dataset will provide the data for the previous period, at the right aggregated level.
First, let's start by duplicating the original dataset in DV. Note that this does not duplicate the source file or source table data, it only creates another entry in OAC pointing to the same source data.
Once dataset is duplicated, we need to create a custom 'join-key' column in each dataset which we will use to join the two datasets. That happens in the data preparation tab of DV. The column we create in our case is a 'month-key' column. in the original dataset it's simply a month sequence showing YEAR*100+MONTH_NUMBER. For example a date like 21-Jan-2012 will show a month key of 201201
So we create this column in both datasets, but the trick is that in one of the datasets we add or substract 1 to the year number (depending on which dataset). In my case, I will use the duplicated dataset to show year ago data, so I create a column in this dataset with a '+1' in the year number. I could just as well have created a 'Year-1' column in the other dataset.
That way, when we join both datasets via this month-key, records with for example year 2013 in the original dataset will join to the records with year 2012 in the Yago dataset : 2013 = 2012 + 1. So now we join the datasets in DV data prepare :
Note that we join on the month key column, but we must also join on every other column that we want our analysis to potentially aggregate on : Customer Segment and Product Category in our case. If we don't join on these, our reports by Customer Segment and Product Category will not give detailed results.
So once this is done, we just have to build visualizations on the joined datasets. One more important point : by default visualizations will show a join type (Data Blending icon, on each viz properties tab) of All Rows joining with All Rows (full outer joins). In our case, we need to set this to 'Only Matching Rows' for the Yago dataset. This viz config will be needed for each viz we build using the two datasets:
With this, we can now build all sorts of visuals and calculations using the Yago Sales metric. Because we specifically joined on month-key,Customer Segment & Product Category, all these computation will aggregate correctly at the levels of Month & above (Quarter, Year), Customer Segment & above, and Product Category & above.
This technique can be used in a similar way in DV Data Flows, but in this case, datasets do not need to be duplicated. Also, default joining in Data Flows there is not of type full outer. That simplifies the various Vizs configuration process. An upcoming blog post will describe how to optimally use this technique in a Data Flow.