Merging 2 data sets into a single one is a common need for analysts manipulating diverse data sources. Oracle Analytics Cloud's Data Flow enables an friendly way to do this within the context of preparing data, just before building visualizations and deriving insights out of it.
This blog highlights the different scenarios in which union rows step of the data flow can be leveraged.


This blog highlights the different scenarios in which union rows step of the data flow can be leveraged.
Prerequisites for using the Union Rows step in Data Flows
The Union-Rows step in Data Flows can merge 2 data sets into a single one, provided the two input sources have the same structure. It operates in a similar way to the SQL Union operation in the database, where result set of 2 queries are merged into a single output :- Both the data sets should have same number of columns,
- The data types of the corresponding columns in data sets should match. For example column1 of data set 1 must have the same data type as column1 of data set 2 and so on.
In other words, you can easily merge datasets that are of similar format. For example sales data for different months are in different datasources, or HR data for various subsidiaries are in different files, etc.
So, for our example, lets consider 2 data sets with sales order information for 2 separate months, Jun-2019 and Jul-2019. This data has columns like Order Priority, Customer Name, Product Category, Product Name and Sales as a metric. There are some customers in these data sets who have purchased the same product across the two months.
Data Set - June 2019 (100 rows)

Data Set - July 2019 (100 rows)

We have 10 rows of customers who have purchased the same products across the two months. We will see how these 10 rows of duplicate data across the two months are handled in the various Union operations discussed below.

How to create a Union Row step in Data Flow?
Lets add both the data sets to an Oracle Analytics Data Flow, and further down in our Data Flow click on the "+" icon and choose Union Rows step. The Union Rows step gets enabled only when there is more than one data set added in the Data Flow.

As the step adds to the Flow, click on the suggested 'second' data node to complete the Union Step. that is just to indicate which two data-sets we want to union.
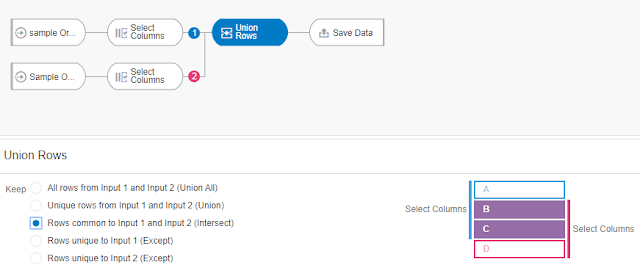
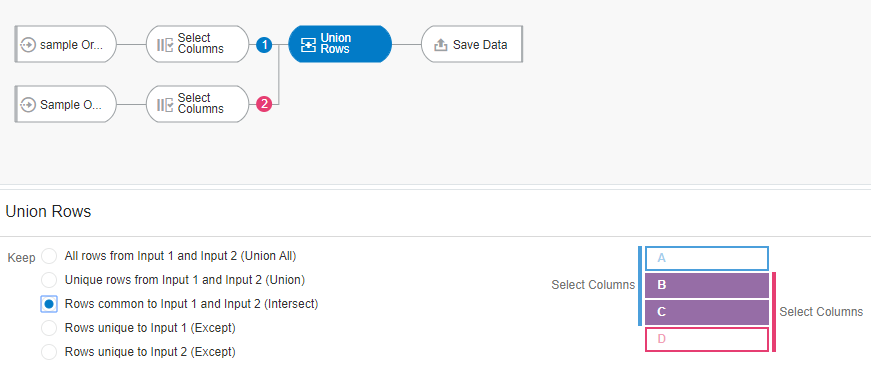
The details of this node presents various options in which an Union operation can be performed are presented along with a visual representation of the chosen option. The visual representation clearly specifies what would be the resulting data set when the options are chosen. The Options available are
The details of this node presents various options in which an Union operation can be performed are presented along with a visual representation of the chosen option. The visual representation clearly specifies what would be the resulting data set when the options are chosen. The Options available are
- All rows from input1 and input2 (Union All)
- Unique rows from input1 and input2 (Union)
- Rows common to input1 and input2 (Interesct)
- Rows unique to input1 (Except)
- Rows unique to input2 (Except)
Use Case 1: Merge both the data sets
Lets say we want to merge both sets into a single data set for reporting purposes and keep all the rows. In this scenario, all the rows from data set 1 has to be merged with all the rows from data set 2 (equivalent to a Union All operation in SQL). This operation will not eliminate any duplicate records.The visual representation of this operation is shown on the right of the screen, explaining how the resulting data set would look like.

So let's complete our Data Flow with the two input data sets, use the Unions Rows node with the first option selected and execute the flow.

When the data flow is executed, a Data Set is created with the merged output, and its total number of rows (which can be calculated using a formula like sum(1)) is 200. This shows that the union operation merged both the data sets without removing any duplicates.

Use Case 2: Merge without duplicates
Lets now say we want to merge both the data sets but only want to keep the distinct combinations of customers and products they purchased over the two months. In effect, we want to remove duplicates across the two data sets with these same combinations. This is similar to a Union operation in SQL. A Union operation merges the rows from both the data sets by eliminating the duplicates and retaining a single copy of the duplicate rows
In order to achieve this, lets trim down the data set by retaining only customer and product related columns. So we achieve this by using a 'Select Columns' node just before our Union Rows node, and we keep only the following columns : Customer Name, Product Category, Product Sub Category, Product Container and Product Name. Let's now perform a Union Rows on these two data-sets and select the second option which is 'Unique rows from Input 1 and Input 2.'

When the data flow is executed and creates the merged output, we notice that row count in resulting data set is 190. This shows that only one copy of the duplicate records (10) were retained in the output.

Use Case 3: Rows common from input1 and input2
Now lets say we want to find the list of customers who have ordered the same products twice, once in June and once in July. In this scenario, we have to find the common records with same customer and same product between the two data sets. This is similar to an intersect operation in SQL.
Let's define the data flow similar to the one described in Use Case 2 with just the customer and product related columns selected and apply a Union rows node with the third option 'Rows common to Input 1 and Input 2'.
Let's define the data flow similar to the one described in Use Case 2 with just the customer and product related columns selected and apply a Union rows node with the third option 'Rows common to Input 1 and Input 2'.
When the data flow is executed and creates the merged output, we notice that row count in resulting data set is 10. Only one copy of the duplicate records were retained in the output. The detailed tabular reports shows the exact intersecting records between the data sets

Use Case 4 and 5 : Rows unique to input1 (Except)
Finally, lets say we are interested in those customers and products that were ordered only in June but were explicitly not ordered in July. Both the data sets have to be merged by retaining only the unique records in the first data set. This is equivalent to an except operation in SQL.
Let's again define the data flow and choose the option 'Rows unique to Input 1'
Let's again define the data flow and choose the option 'Rows unique to Input 1'

When the data flow is executed and creates the merged output, we notice that record count in resulting data set is 90, meaning only those records in the first data set except the records that are common to the second data set are saved in the output.

Note that if a user needs to merge more than two data sets, it can be done in multiple steps in the same Data Flow : first merge two data sets, then merge the output to the third data set and so on.
Union-Rows node allows a friendly way to merge two data sets in an Oracle Analytics Data Flow. It will work agnostic to the type of data source, as long as the respective structure of the data is identical.
Are you an Oracle Analytics customer
or user?
We want to hear your story!
Please voice your experience and provide feedback
with a quick product review for Oracle Analytics Cloud!